Chrome DevTools: Grid Explorer

I like to look at the "What's New" tab in Chrome Dev Tools every now and then.
This time the update is 87, and I've noted they updated the CSS Grid debugging options!
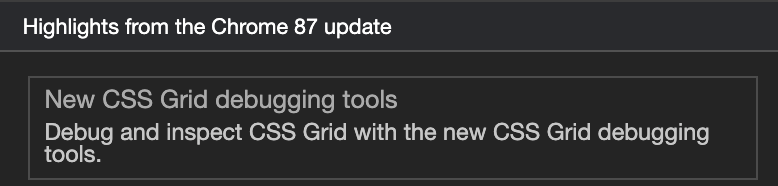
Time to explore what's new and what it can do for us!
Chrome Dev Tools CSS Grid debugging
First, we need to open the Chrome Dev Tools.
Mac
Cmd+Shift+Cor Windows:Ctrl+Shift+C.
Now we can use the Elements inspector where we can see all the elements in there you will see the [grid] block behind grid elements; this was the existing feature.

This little toggle will show us the grid overview, but that is about it.
In the new feature, there is a whole grid explorer under the Layout tab.
You can find the layout tab on the bottom of your dev tools.
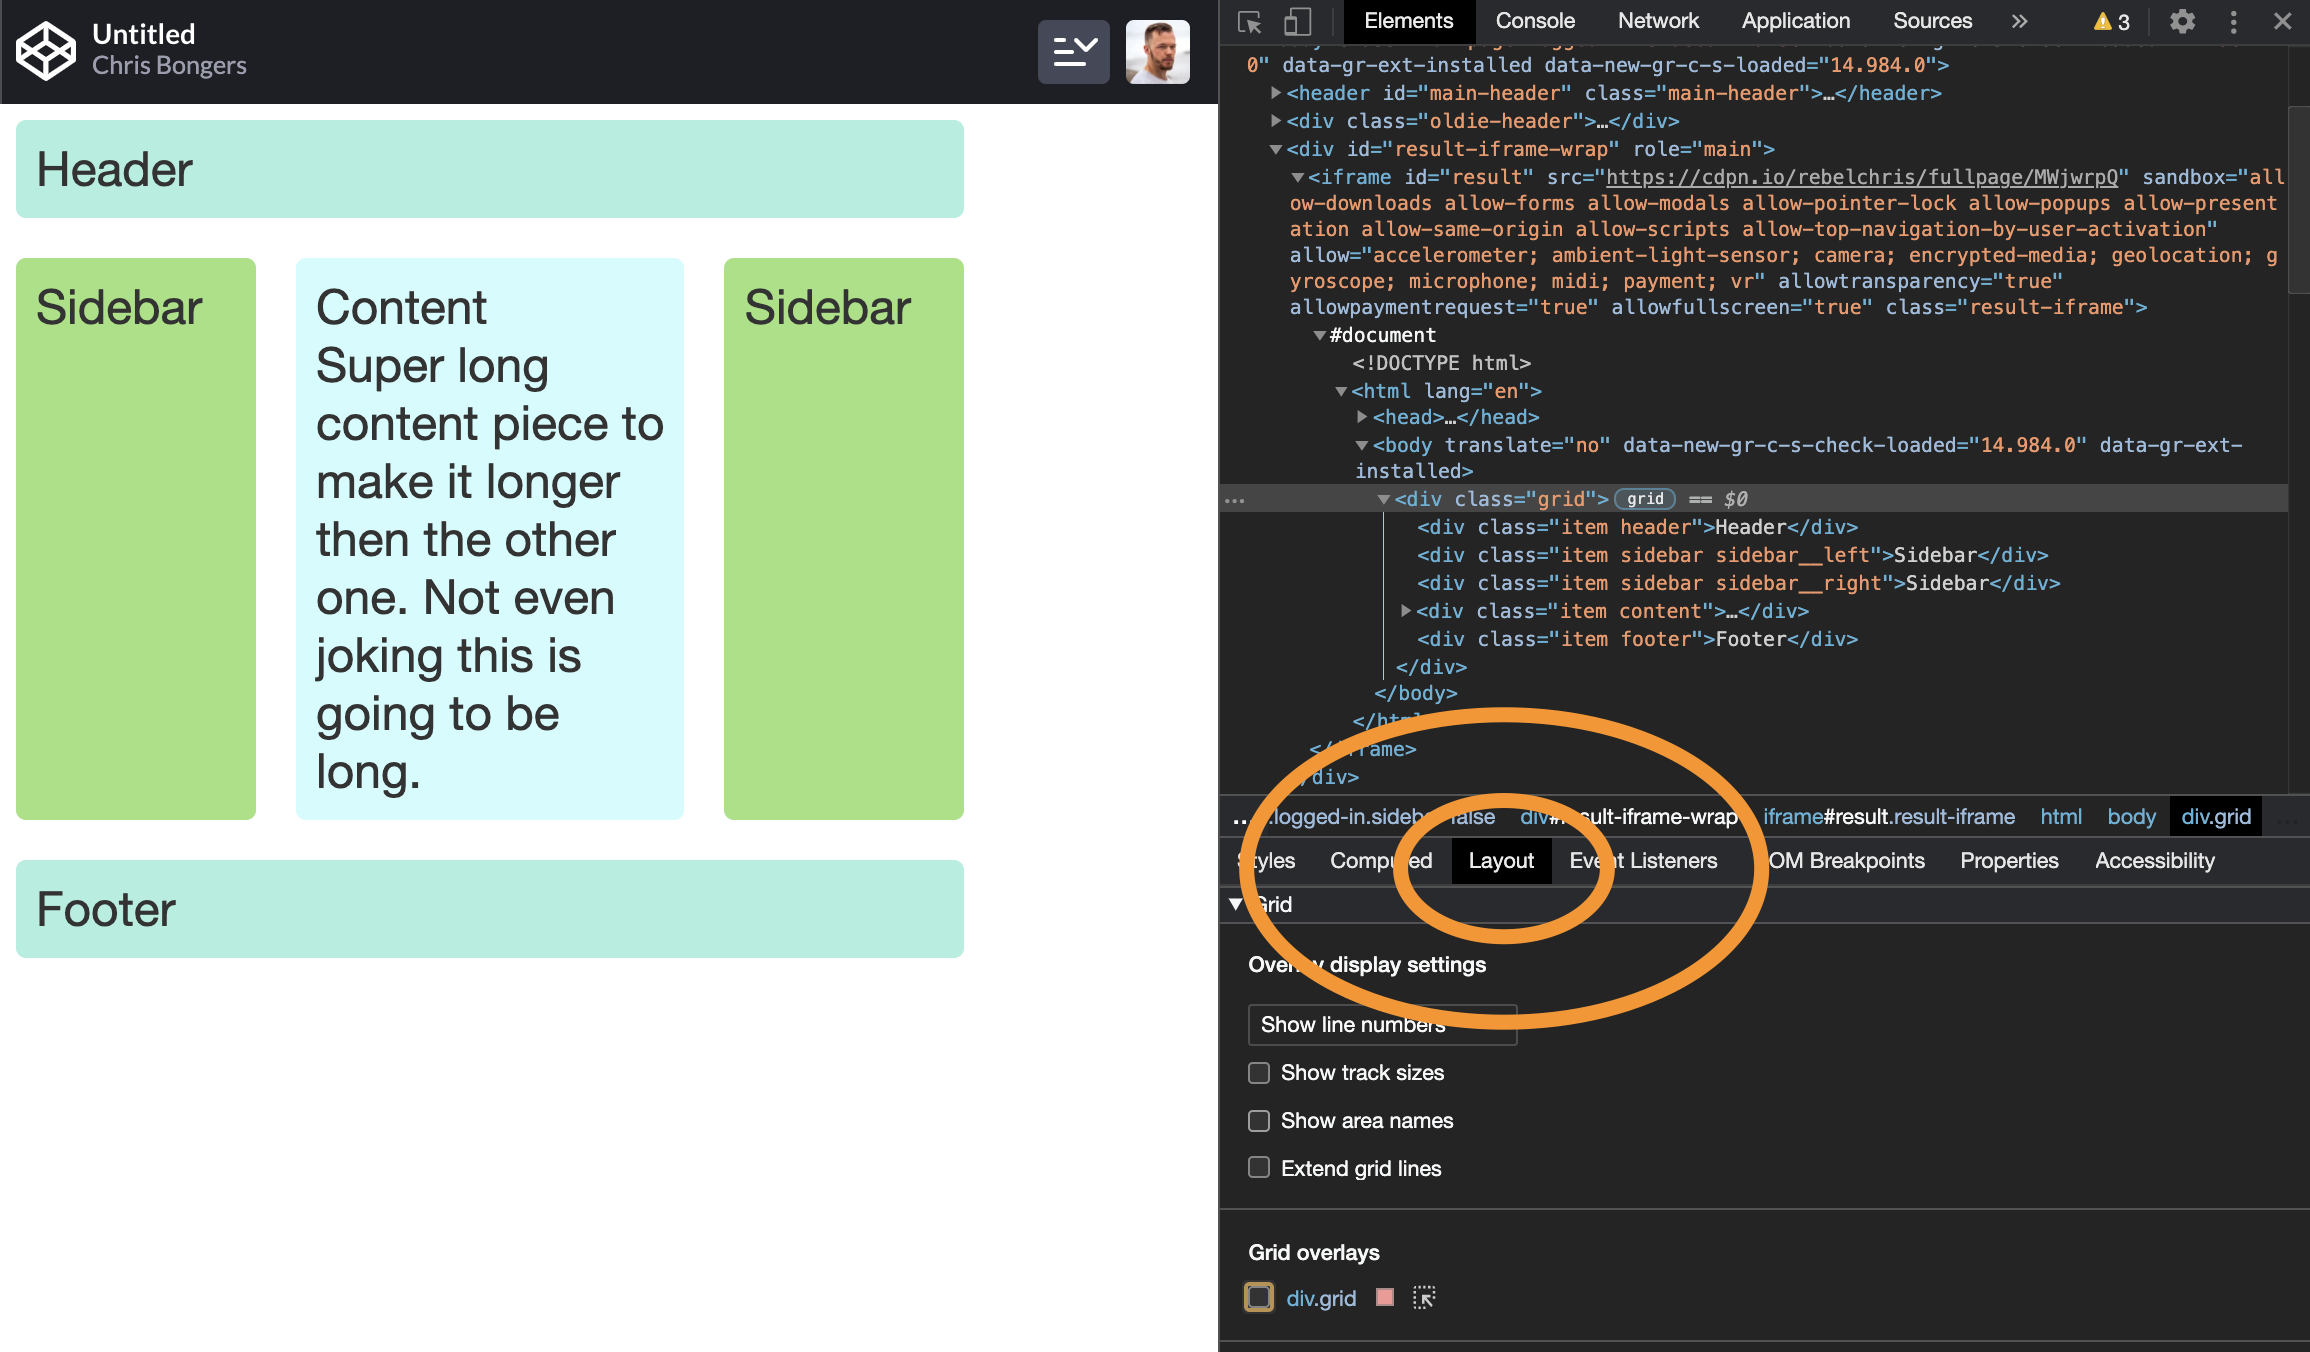
Within this tab you will see all the grids that are on the page. In this case, it's just the one.
You can check the little checkbox before your grid, and it will highlight the grid.
Then next to it is a small color picker so you can change the default red color.
You might think that's not much more than the above [grid] block does.
But there are a bit more powerful items above.
You can toggle the following checkboxes:
- Show track sizes: Will show the sizes of each grid block
- Show area names: Show the names of each area you defined
- Extend grid lines: Will render the grid further on the page
As you can imagine, this can help us really well defining which block is rendered where.
I love this new area names function, and I'm sure it will help many of you exploring how grid works.
Thank you Chrome DevTools for making grid debugging even better!
I've made this little gif to showcase what happens when you toggle each option.

Thank you for reading, and let's connect!
Thank you for reading my blog. Feel free to subscribe to my email newsletter and connect on Facebook or Twitter
About the author
I'm a full-stack developer from South Africa 🇿🇦. I love writing about JavaScript, HTML and CSS.
Comments
Join the discussionI have firefox developer edition and is amazing. I use chrome too but not for testing.
Amazing post Chris sir.
Firefox has some great debugging as well 🦊
Should I just uninstall Firefox now
In either case, you'll need a lot of browsers to test with (or BrowserStack). Rather stick to what works for you.